Download raw (2.2 KB)
#Base for P.cruentum
from chiplotle import *
import math
import random
#
from chiplotle.tools.plottertools import instantiate_virtual_plotter
plotter = instantiate_virtual_plotter(type="HP7550A")
plotter.margins.hard.draw_outline()
plotter.select_pen(1)
def random_nums(total, n, variant):
numbers = []
min = (total / n) * (1 - variant)
max = (total / n) * (1 + variant)
sum = 0
for number in range(n-1):
num = random.randint(int(min),int(max))
numbers.append(num)
sum += num
numbers.append(total-sum)
random.shuffle(numbers)
return numbers
grid_size = 10
y_values = []
x_values = []
width_height = []
position = []
for grid in range(grid_size):
y_values.append(random_nums(2000,grid_size, 0.08))
x_values.append(random_nums(2000,grid_size, 0.08))
# print(x_values)
# print("-------")
# print(y_values)
for x_cord in range(len(x_values)):
x_y = []
x_y_pos = []
x_pos = 0
# print("xxxxxxxxxx")
# print(x_values[x_cord])
# print(y_values[x_cord])
for x in range(len(x_values[x_cord])):
y_pos = y_values[x][x_cord] / 2.0
for y_val in range(x_cord):
y_pos += y_values[x][y_val]
# print(y_pos)
x_y.append([x_values[x_cord][x],y_values[x][x_cord]])
x_pos += x_values[x_cord][x] / 2.0
x_y_pos.append([x_pos,y_pos])
x_pos += x_values[x_cord][x] / 2.0
# print(x_pos)
width_height.append(x_y)
position.append(x_y_pos)
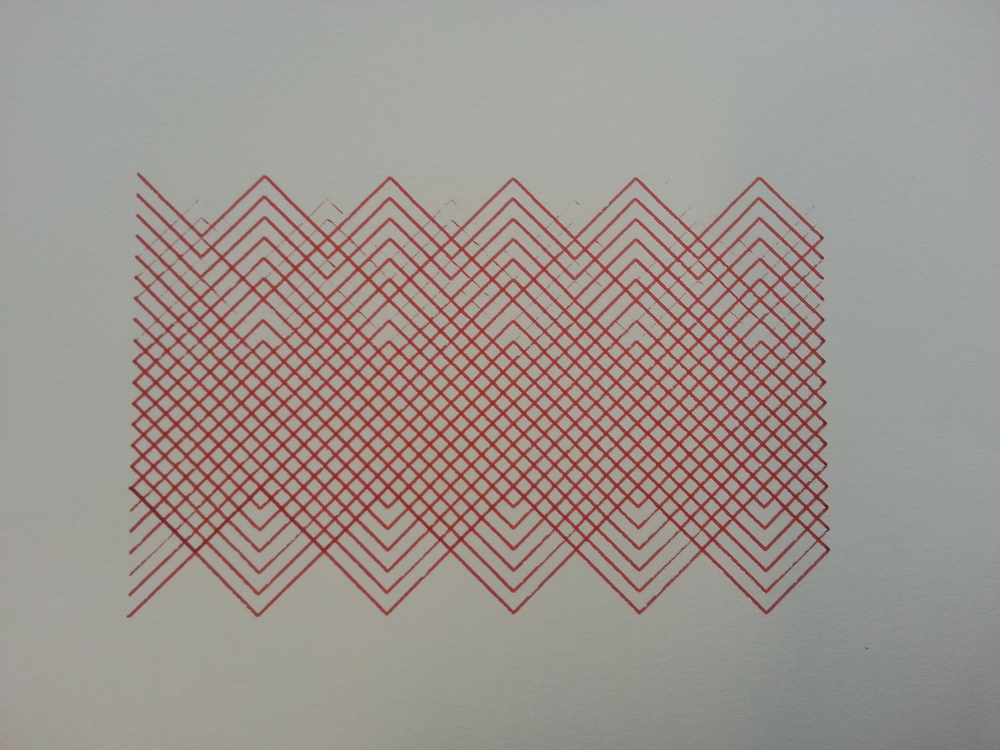
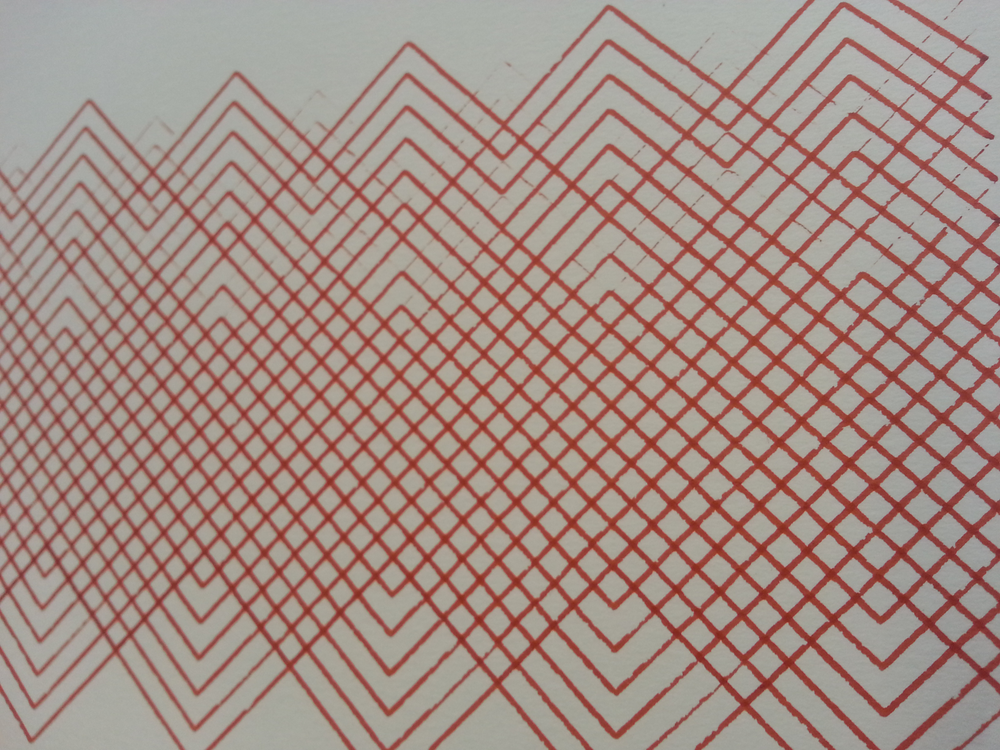
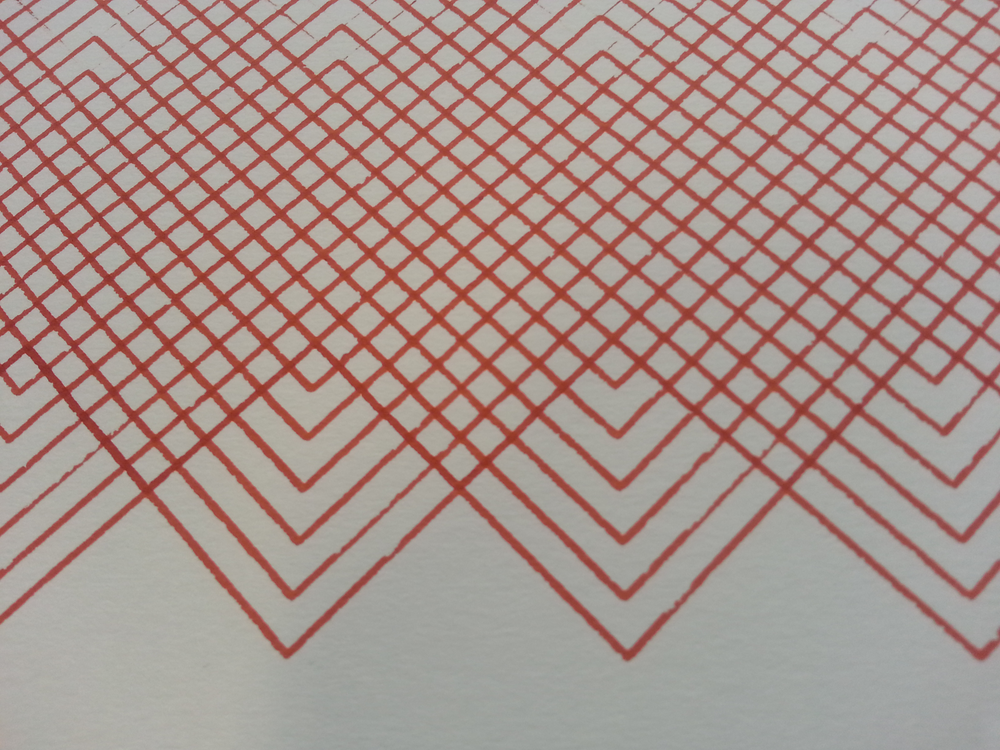
#Drawing the cells
for l in range(len(width_height)):
for c in range(len(width_height[l])):
width = width_height[l][c][0]
height = width_height[l][c][1]
cell = shapes.group([])
outer_shape = shapes.ellipse(width, height)
cell.append(outer_shape)
for i_s in range(7,0, -2):
inner_shape = shapes.ellipse(width * (i_s*0.1), height * (i_s*0.1))
cell.append(inner_shape)
transforms.center_at(cell,(position[l][c][0],position[l][c][1]))
plotter.write(cell)
# print(width_height[l][c])
# print(width_height[l][c][0])
# print(position[l][c])
# print(width_height[l])
# print("*******")
io.view(plotter)