Download raw (2.0 KB)
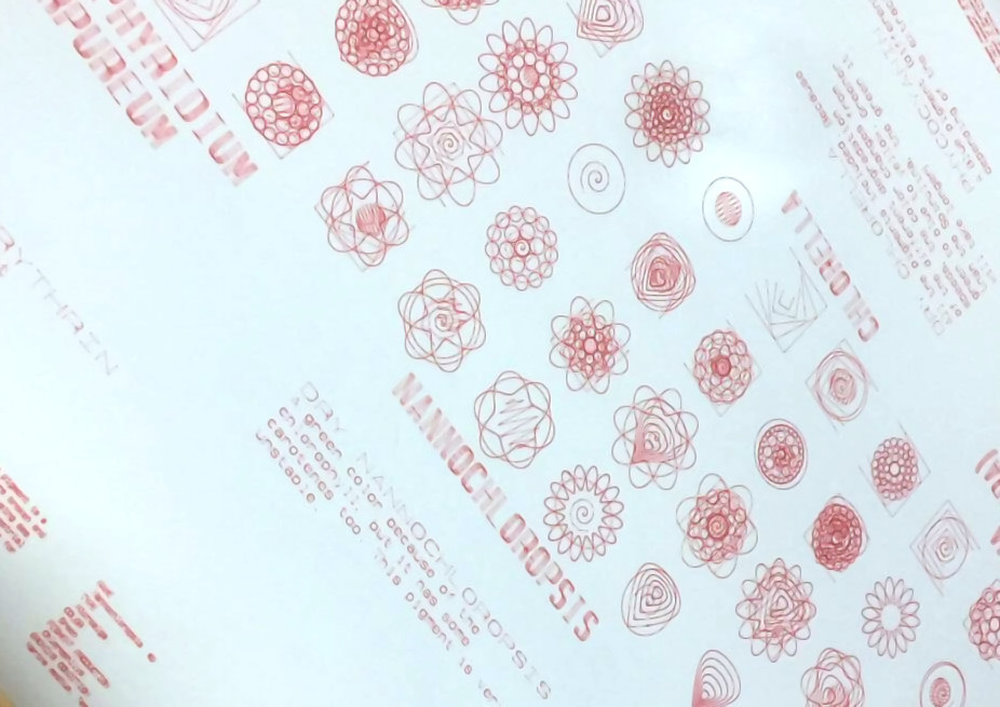
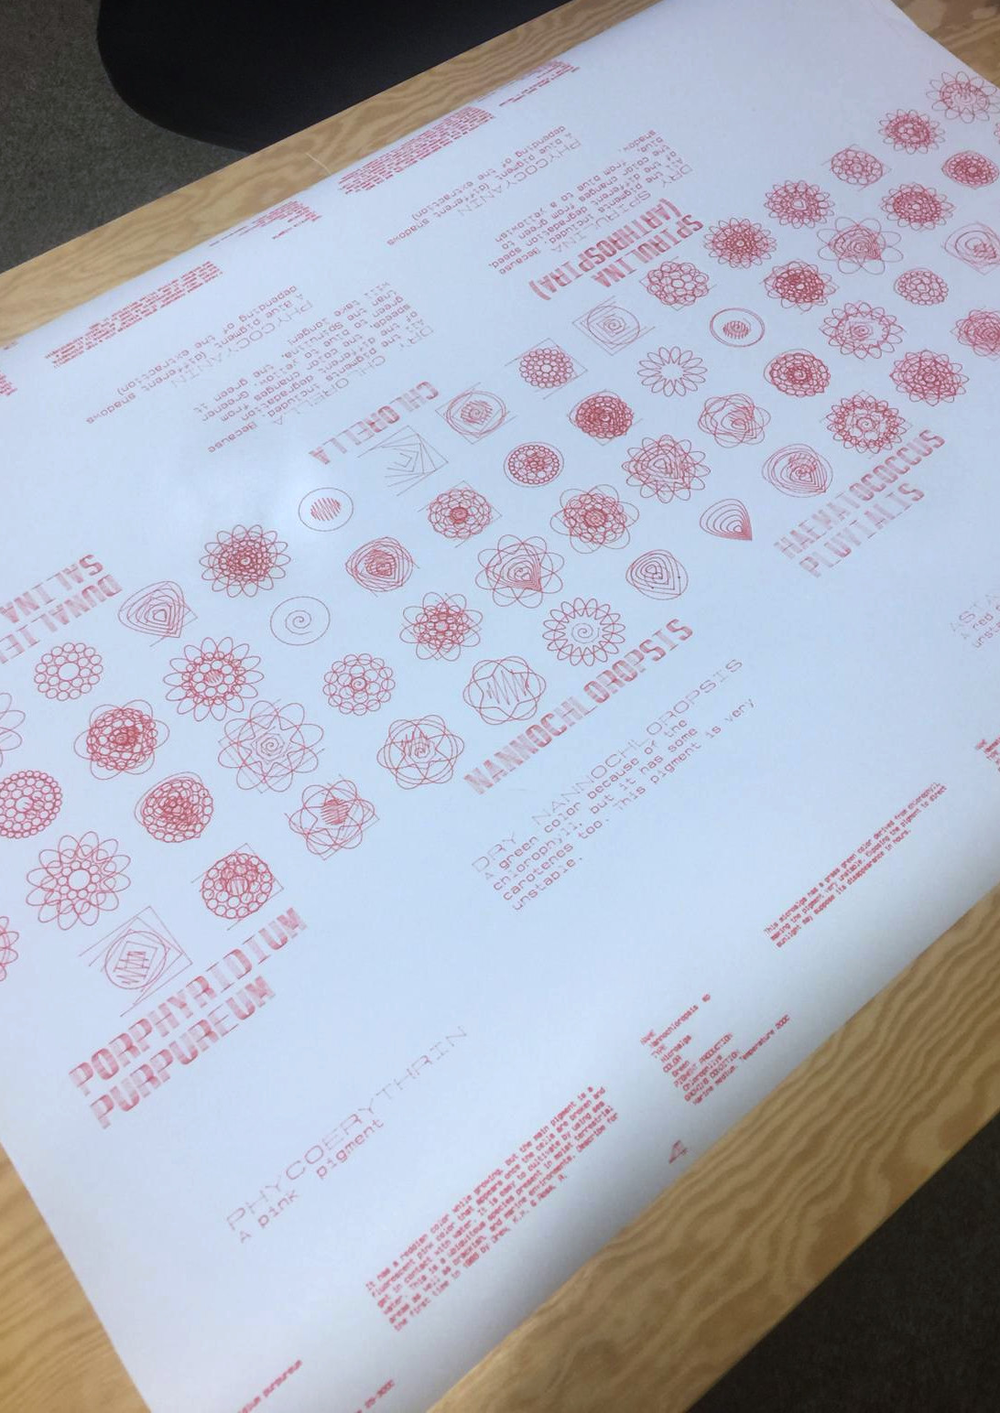
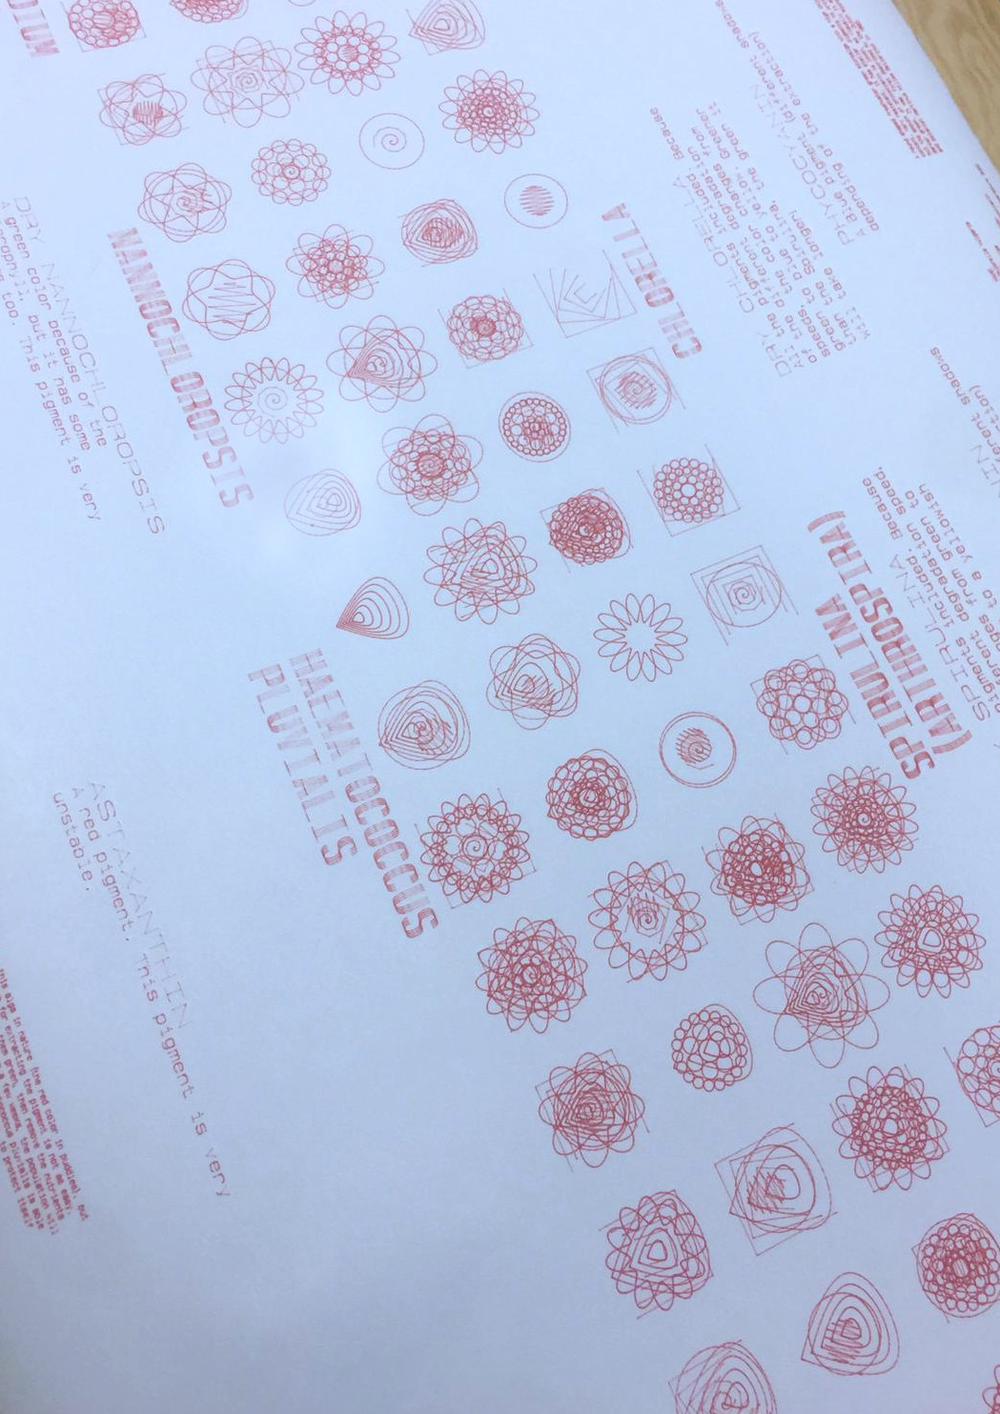
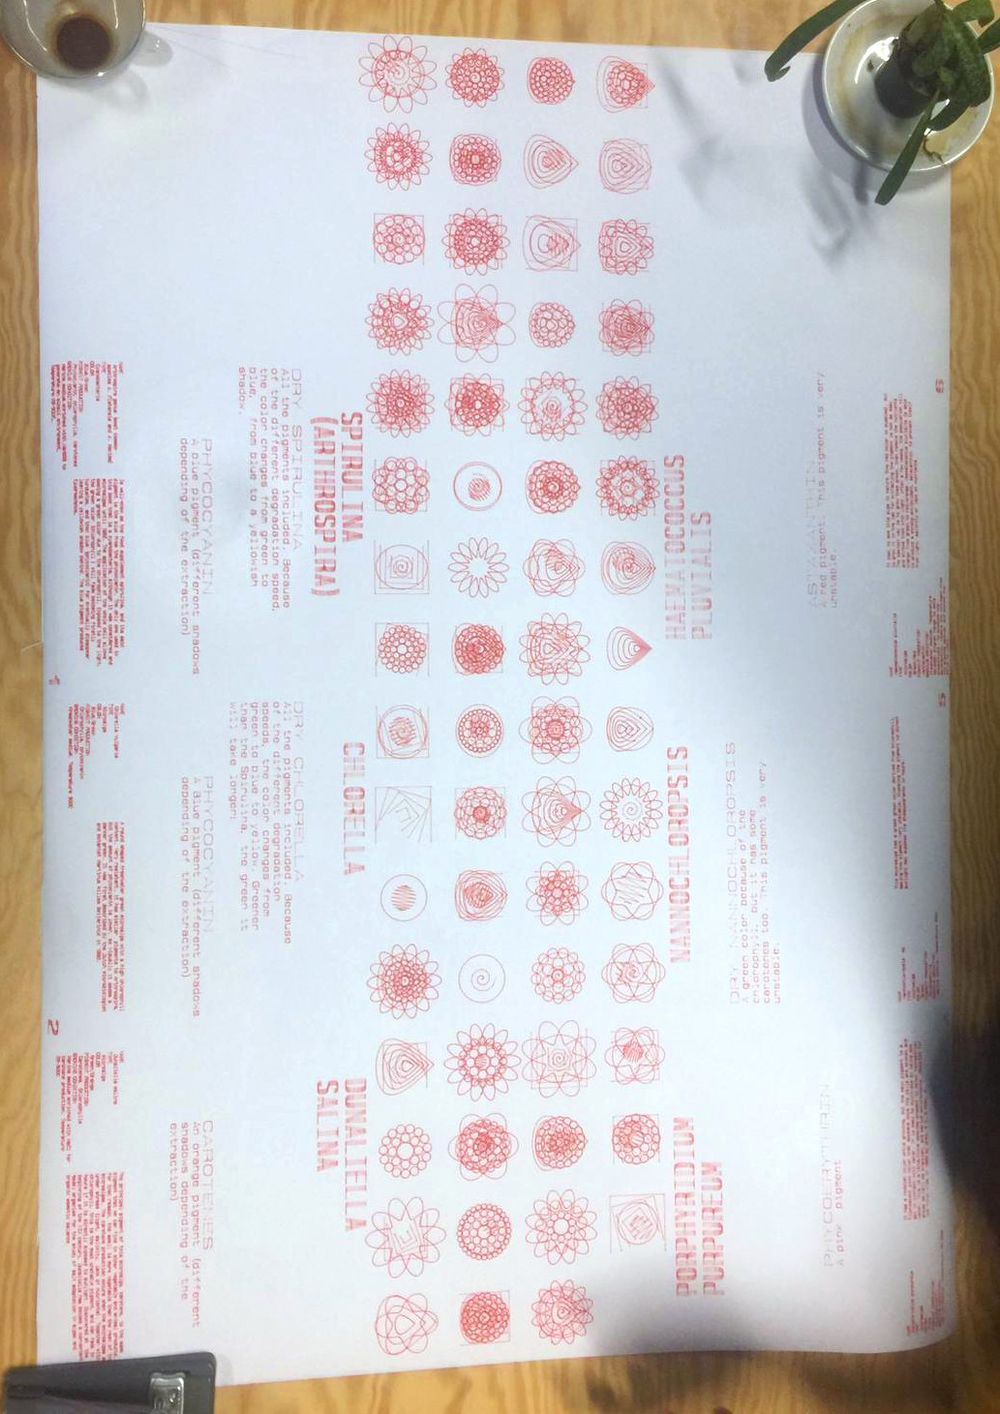
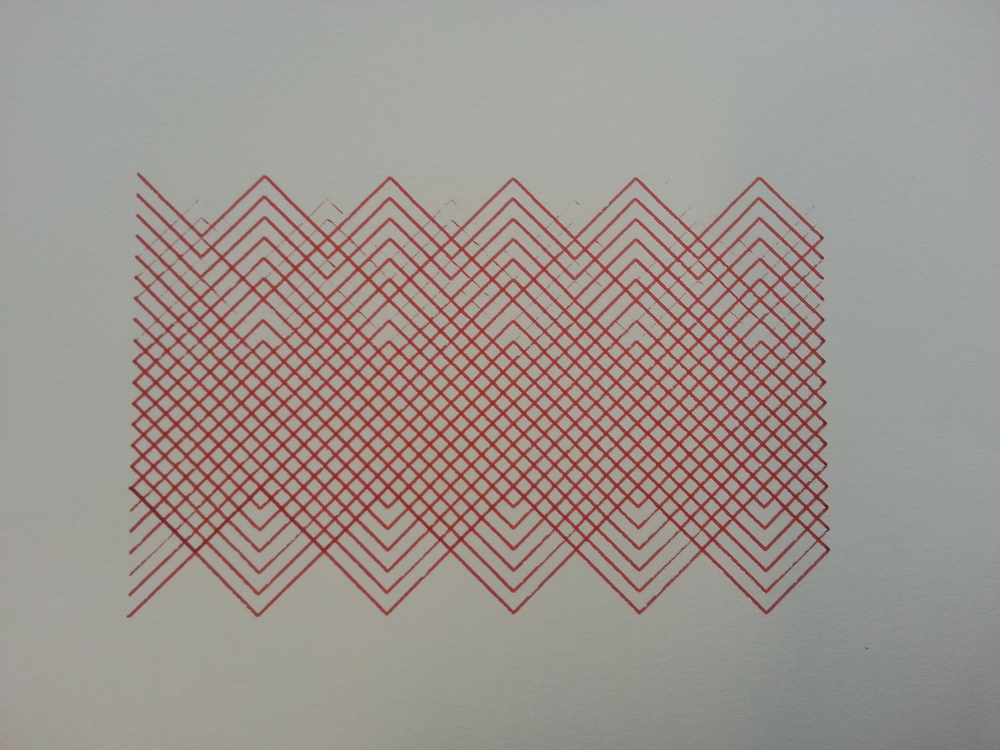
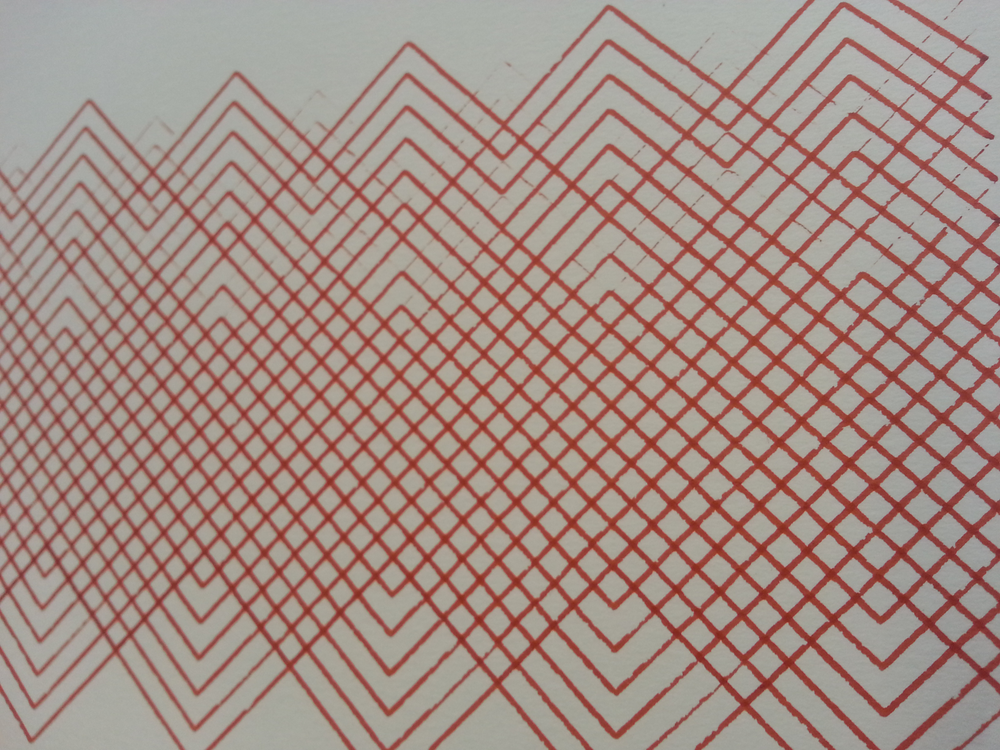
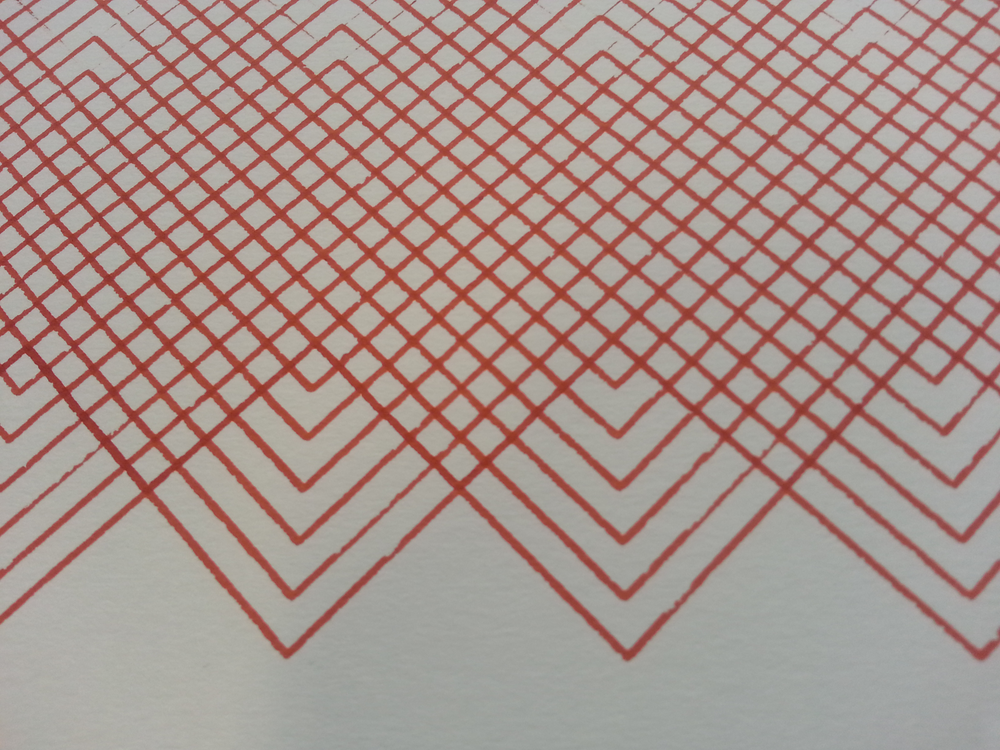
#Base for Nannochloropsis

from chiplotle import *
import math
import random

from chiplotle.tools.plottertools import instantiate_virtual_plotter
plotter =  instantiate_virtual_plotter(type="DXY1300")
plotter.margins.hard.draw_outline()
plotter.select_pen(1)

# plotter = instantiate_plotters( )[0]
# plotter.select_pen(1)

def nanno_cell(base):
    cell = shapes.group([])
    x = [0,0,40,100,140,60,60,140,100,40,0,0,40]
    y = [40,100,140,140,100,100,40,40,0,0,40,100,140]

    x = [0,0,80,200,280,120,120,280,200,80,0,0,80]
    y = [80,200,280,280,200,200,80,80,0,0,80,200,280]

    x = [0,0,int(base*0.286),int(base*0.714),int(base),int(base*0.429),int(base*0.429),int(base),int(base*0.714),int(base*0.286),0,0,int(base*0.286)]
    y = [int(base*0.286),int(base*0.714),int(base),int(base),int(base*0.714),int(base*0.714),int(base*0.286),int(base*0.286),0,0,int(base*0.286),int(base*0.714),int(base)]

    change = base * 0.1
    for i in range(2):
        coordinates = [(x[0],y[0]), (x[1],y[1]), (x[2],y[2]), (x[3],y[3]), (x[4],y[4]), (x[5],y[5]), (x[6],y[6]), (x[7],y[7]), (x[8],y[8]), (x[9],y[9]), (x[0],y[0])]
        cell_shape = shapes.path( coordinates)
        cell.append(cell_shape)
        # plotter.write(cell_shape)
        x[0] += change
        y[0] += change

        x[1] += change
        y[1] -= change

        x[2] += change
        y[2] -= change

        x[3] -= change
        y[3] -= change

        x[4] -= change * 3
        y[4] += change

        x[5] -= change
        y[5] += change

        x[6] -= change
        y[6] -= change

        x[7] -= change  * 3
        y[7] -= change

        x[8] -= change
        y[8] += change

        x[9] += change
        y[9] += change

    return(cell)
x_unit = 400 * 0.657 #cm
y_unit = 400 * 0.6187 #cm

posx = 2*x_unit
posy = 3500
for i in range(8):
    hcell = nanno_cell(750)
    transforms.rotate(hcell,math.radians(random.randint(0,360)))
    transforms.center_at(hcell,(posx,posy))

    print(hcell.width)
    plotter.write(hcell)
    posx += 4*x_unit

plotter.select_pen(0)

io.view(plotter)